
Disclaimer & Notice
This mathematical modeling framework is an empirical, data-driven optimization methodology developed for strategic diagnostic and consulting references. It is NOT an official Amazon algorithm, nor does it replace the platform’s advertising rules. It serves as a standardized decision-making logic for manual campaign tuning, AI automation, and multi-agent ad orchestration. All optimization actions must comply with Amazon’s changing advertising policies and data latency constraints.
Introduction: Reining in Ad Entropy through Mathematical Modeling
In 2026, relying on “gut feeling” to manage Amazon PPC budgets is a fast track to failure. Subjective optimizations inevitably lead to erratic ACoS, massive ad spend waste, and a slow erosion of organic market share.
Most sellers split defense and offense budgets blindly, judge keyword value solely by search volume, and chase competitor traffic without a measurable ROI standard. This creates chaotic operations—or what we call “Advertising Entropy.”
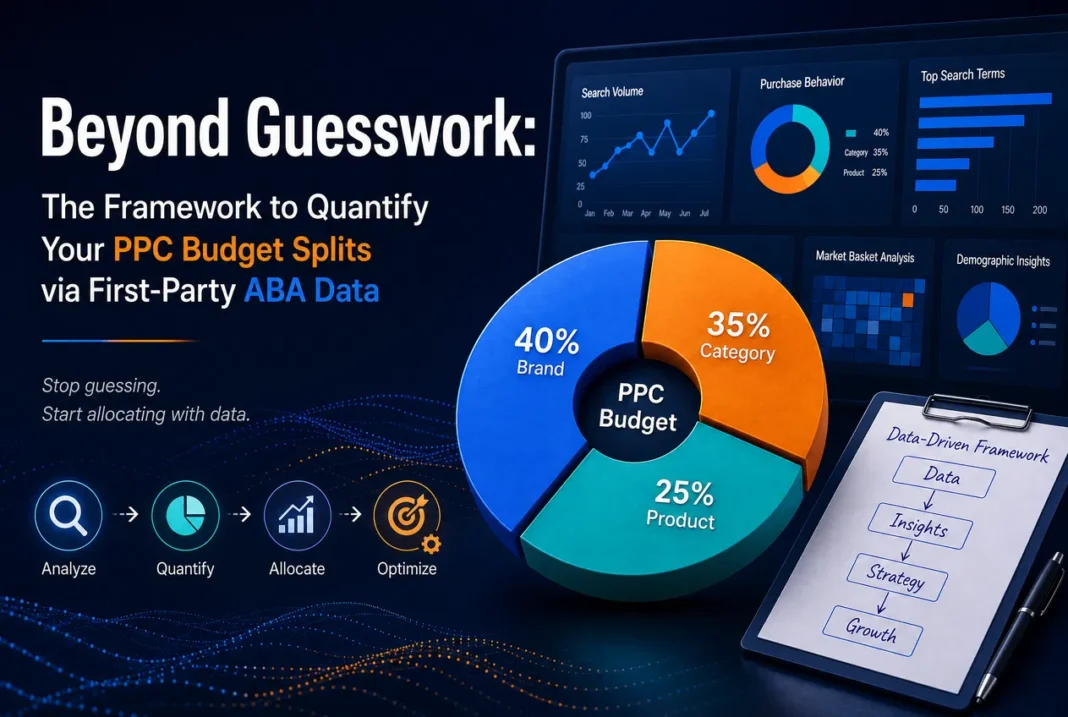
To achieve global entropy reduction, elite brands leverage deterministic, first-party data from Amazon’s Brand Analytics (ABA) and Search Query Performance (SQP). By integrating three mathematical dimensions—Conversion Efficiency ($E$), Monopoly Profit Base, and Competitor Leakage Gap ($G_{\text{leak}}$)—this guide establishes a fully quantifiable, risk-controlled PPC budgeting and keyword diagnostic framework.
Part 1: Unified ABA Variable Definition (100% First-Party Data)
All parameters are extracted directly from official Amazon backend reports. No third-party speculation, no fabricated metrics:
- $S$: Monthly search volume of a single keyword (Total category traffic scale).
- $C_{\text{self}}$ / $P_{\text{self}}$: Brand Click Share / Brand Purchase Share under this specific search term.
- $C_{\text{comp}}$ / $P_{\text{comp}}$: Combined Click Share / Combined Purchase Share of the Top 3 competing ASINs.
- $\text{CPC}_{\text{target}}$: The targeted Cost-Per-Click allocated for the keyword or campaign.
- $\text{ACoS}_{\text{target}}$: The target Advertising Cost of Sales/efficiency threshold for the campaign.
Part 2: Model 1 — Conversion Efficiency Ratio ($E$) | The Defense Guardrail
2.1 The Standard Formula
$$E = \frac{P_{\text{self}}}{C_{\text{self}}}$$
2.2 Plain Language Business Interpretation
What this actually means: Not every high-traffic keyword is worth fighting for. We only dedicate heavy defensive budgets to keywords where your traffic-to-order conversion capability significantly outperforms the category average.
If your Purchase Share ($P_{\text{self}}$) is vastly higher than your Click Share ($C_{\text{self}}$), it means your listing is a conversion machine for this term. If competitors steal these clicks, your core profit will be directly eroded.
2.3 Quantitative Diagnostic Benchmarks
- $E \ge 1.4$ (High-Efficiency Asset): Your listing converts traffic far better than the category average. Mark as a [Core Defensive Keyword]—you must lock down ad placements (Top of Search via Sponsored Products & Sponsored Brands) to safeguard this profit engine.
- $E < 1.4$ (Low-Efficiency Term): Your traffic conversion is below par. It lacks defensive moat attributes; route it to the general traffic pool without budget priority.
The Professional Guardrail Rule: If a keyword contains your exclusive brand root word, or your purchase share $P_{\text{self}} \ge 40\%$, it enters the Core Defensive Pool automatically, regardless of its $E$ value.
Part 3: Model 2 — Asymmetric Traffic Gap Model | Offensive Conquesting Filter
3.1 Core Gap Formulas
- Untapped Market Volume ($V_{\text{market}}$):$$V_{\text{market}} = S \times (1 – C_{\text{self}})$$
- Competitor Leakage Gap ($G_{\text{leak}}$):$$G_{\text{leak}} = S \times (C_{\text{comp}} – P_{\text{comp}})$$
3.2 Plain Language Business Interpretation
What this actually means: Blindly bidding against top-tier competitors is the leading cause of ad spend bleed. The most elegant offensive strategy is simple: Intercept high-volume traffic that your competitors capture but fail to convert.
$G_{\text{leak}}$ calculates the exact monthly volume of shoppers who click competitor listings but leave without buying due to poor pricing, bad reviews, or weak listing content. These frustrated shoppers are your highest-ROI conquesting targets. Intercepting them gives you low CPC and high conversion without engaging in a brutal bidding war with dominant rivals.
3.3 The Triple Offensive Threshold (Strict Filter)
A keyword is classified as a [High-ROI Offensive Target] only if all three conditions are met simultaneously:
- $C_{\text{self}} \le 20\%$ (Low local brand penetration; ample room for growth).
- $C_{\text{comp}} \ge 30\%$ (Competitors control the mainstream traffic funnel).
- $P_{\text{comp}} \le 20\%$ (Competitors show severe conversion funnel leakage; $G_{\text{leak}}$ is substantial).
Part 4: Model 3 — Weighted Budget Allocation Model (With Financial ROI Modifiers)
4.1 Pool Weight Calculation
To completely eliminate the “monopoly paradox” (where dominating a keyword accidentally slashed its defense budget in older models), we utilize Absolute Profit Contribution for defense. Furthermore, we introduce a Financial ROI Modifier ($\gamma$) to prevent hyper-expensive CPC terms from eating up all your money.
- Defensive Pool Total Weight ($W_{\text{def}}$):$$W_{\text{def}} = \sum \left( S \times P_{\text{self}} \times E \times \gamma_{\text{def}} \right)$$
- Offensive Pool Total Weight ($W_{\text{off}}$):$$W_{\text{off}} = \sum \left( G_{\text{leak}} \times \gamma_{\text{off}} \right)$$
4.2 Financial ROI Modifier ($\gamma$) Definition
$$\gamma = \frac{\text{ACoS}_{\text{target}}}{\text{CPC}_{\text{target}}}$$
Plain Language Business Interpretation: $\gamma$ acts as your financial emergency brake. If a keyword’s CPC is extremely high or your target ACoS is tight, $\gamma$ drops significantly. Mathematically, this automatically suppresses the keyword’s weight in the budget pool, ensuring that high-volume but unprofitable keywords cannot hijack your cash flow.
4.3 Dynamic Budget Split Allocation
Budgets are dynamically split by pairing pool weights with strategic coefficients (Defense Priority Coefficient: $\alpha$, Offense Priority Coefficient: $\beta$):
$$\text{Budget}_{\text{def}} = \text{Total}_{\text{budget}} \times \frac{W_{\text{def}} \times \alpha}{W_{\text{def}} \times \alpha + W_{\text{off}} \times \beta}$$
$$\text{Budget}_{\text{off}} = \text{Total}_{\text{budget}} – \text{Budget}_{\text{def}}$$
Part 5: Deep Dive into Strategic Coefficients ($\alpha / \beta$) & Business Logic
The coefficients $\alpha$ and $\beta$ act as strategic levers, adapting to your brand lifecycle and category dynamics:
| Brand Strategy / Category Stage | Defense Coeff (α) | Offense Coeff (β) | Strategic Orientation |
| Mature Brand / Profit Protection (Default) | 0.6 | 0.4 | Safeguard core profit margins and cash flow; safety-first. |
| New Product Launch / Aggressive Expansion | 0.3 | 0.7 | Penetrate rival funnels and conquer competitor leakage traffic. |
| Hyper-Competitive Red Ocean / Anti-Poaching | 0.7 | 0.3 | Reinforce the fortress; raise the cost for rivals trying to steal market share. |
| Low-Competition Blue Ocean / Balanced State | 0.5 | 0.5 | Balanced allocation; simultaneously protect and explore. |
5.1 Why Set 0.6 Defense / 0.4 Offense as the Baseline?
Advanced operators often dispute this balance. The logic is rooted in operational risk management:
- The 0.6 Defensive Base Logic: Defensive keywords represent zero-risk, stable cash flow. They have proven high conversion efficiency ($E \ge 1.4$) and carry organic ranking equity. If a competitor hijacks these keywords, your core profit margins drop permanently. For a mature brand, defending your home turf is always the highest priority to maintain enterprise safety margins.
- The 0.4 Offensive Base Logic: Offensive traffic is high-volatility incremental traffic. Competitors might optimize their listings or slash prices tomorrow to fix their leaks, or a swarm of sellers might bid on the same gap, skyrocketing the CPC. Offense is for growth; defense is for survival. Therefore, offense cannot hijack your baseline budget.
Part 6: Step-by-Step Practical Calculation Simulation
Let’s simulate a real-world scenario with a Total Daily Ad Budget of $1,000 for a mature brand ($\alpha = 0.6, \beta = 0.4$).
Step 1: Data Input from Backend
- Core Defensive Keyword A: $S = 50,000$, $C_{\text{self}} = 30\%$, $P_{\text{self}} = 45\%$, $\text{CPC} = \$1.50$, $\text{Target ACoS} = 30\%$.
- High-ROI Offensive Keyword B: $S = 80,000$, $C_{\text{self}} = 5\%$, $C_{\text{comp}} = 40\%$, $P_{\text{comp}} = 15\%$, $\text{CPC} = \$2.00$, $\text{Target ACoS} = 40\%$.
Step 2: Running the Models
- Keyword A (Defense):
- $E = 0.45 / 0.30 = 1.5 \ge 1.4 \rightarrow$ Confirmed Defensive Asset.
- $\gamma_{\text{def}} = 0.30 / 1.50 = 0.2$
- $W_{\text{def}} = 50,000 \times 0.45 \times 1.5 \times 0.2 = 6,750$
- Keyword B (Offense):
- Meets triple filters ($C_{\text{self}} \le 20\%, C_{\text{comp}} \ge 30\%, P_{\text{comp}} \le 20\%$).
- $G_{\text{leak}} = 80,000 \times (0.40 – 0.15) = 20,000$
- $\gamma_{\text{off}} = 0.40 / 2.00 = 0.2$
- $W_{\text{off}} = 20,000 \times 0.2 = 4,000$
Step 3: Strategic Budget Distribution
- $\text{Defense Score} = W_{\text{def}} \times \alpha = 6,750 \times 0.6 = 4,050$
- $\text{Offense Score} = W_{\text{off}} \times \beta = 4,000 \times 0.4 = 1,600$
- $\text{Total Score} = 4,050 + 1,600 = 5,650$
- $\text{Budget}_{\text{def}} = \$1,000 \times (4,050 / 5,650) = \mathbf{\$716.80}$
- $\text{Budget}_{\text{off}} = \$1,000 – \$716.80 = \mathbf{\$283.20}$
Strategic Diagnostic Insight:
In traditional PPC operations, sellers easily fall into the “Incremental Temptation vs. Core Asset Neglect” cognitive trap.
Looking at the data, the competitor leakage gap of Keyword B ($G_{\text{leak}} = 20,000$) represents a highly visible, exposed pool of frustrated rival traffic—making it look like a massive, immediate prize compared to the brand’s low current footprint (only 4,000 baseline clicks) on that term. Conversely, because Keyword A is already heavily dominated by the brand (holding a 45% purchase share), operators often become numb to its value, assuming it requires no further aggressive protection.
The mathematical model shatters this subjective bias. By calculating the Absolute Profit Contribution ($S \times P_{\text{self}} \times E$), the framework mathematically proves that Keyword A’s underlying volume ($50,000$ search volume driving $22,500$ highly-optimized conversions) yields a compounding financial moat that dwarfs the volatile $20,000$ leaky clicks of Keyword B. The system coldly forces 71.6% of the budget to safeguard the core cash cow, ensuring that speculative incremental pursuits never compromise the brand’s absolute profit foundation.
Part 7: Practical Implementation SOP & Multi-Agent Workflow
7.1 Multi-Agent Systemic Architecture
- Strategic Agent (Weekly/Monthly Execution): Re-runs clean weekly or monthly ABA/SQP data to dynamically re-classify keywords, adjust the budget caps of defense and offense campaigns, and reduce macro-entropy.
- Execution Agent (Daily/Hourly Execution): Operates safely within these allocated budget boundaries, focusing on micro-tasks like dayparting bid modulation and match-type pruning. This resolves the issue of using static weekly reports to dictate high-frequency daily budgets.
7.2 Manual Campaign Deployment Blueprint
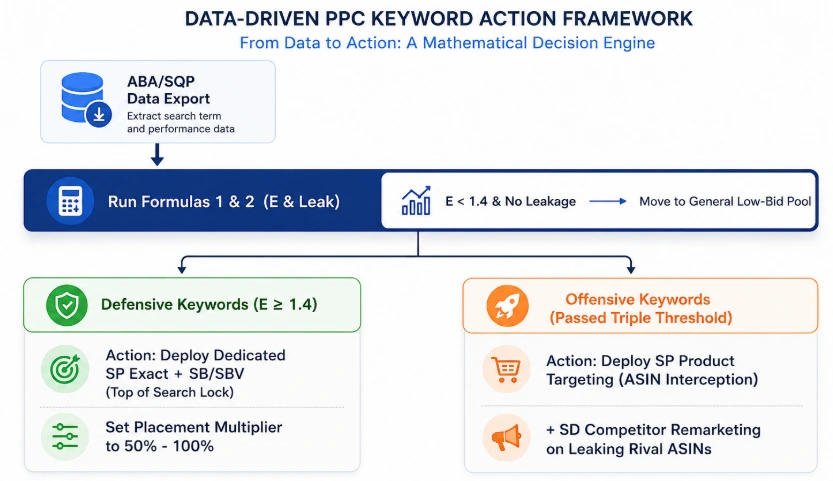
If managing manually, execute the following SOP every Monday upon ABA report updates:
- Isolate Campaigns: Never mix Defensive and Offensive keywords in the same ad group. It causes budget cannibalization.
- Defensive Action: For confirmed defensive terms, use Sponsored Products (Exact Match) and Sponsored Brands Video. Apply a 50%–100% placement multiplier on Top of Search to guarantee impression share.
- Offensive Action: For high-value offensive targets, launch Sponsored Products Product Targeting (PAT) and Sponsored Display (SD) targeting the specific 3 leaking competitor ASINs identified in your ABA report. Capture them directly on their own listing pages.
Part 8: Frequently Asked Questions & Operational Tooling (FAQ)
Q1: The formulas in this framework heavily rely on accurate Keyword Search Volume ($S$) and competitor traffic analysis. Where can I extract this baseline data to calculate Conversion Efficiency ($E$)?
A1: To compute your listing’s core moat attribute via the Conversion Efficiency ratio ($E = P_{\text{self}} / C_{\text{self}}$), you must cross-examine Amazon’s native brand data with historical search analytics. Helium 10 serves as a practical foundation for this keyword intelligence layer.
By leveraging Helium 10‘s keyword research and market intelligence tools, operators can estimate competitor visibility patterns and analyze keyword demand signals across relevant keywords and category segments ($S$). This intelligence output provides the concrete metrics required to feed your formula, transforming raw seller metrics into actionable budget targets without assuming direct access to Amazon’s internal traffic logs.
Q2: To ensure the Conversion Efficiency ($E$) and Competitor Leakage ($G_{\text{leak}}$) models function accurately, how can we eliminate cross-channel data silos within Amazon’s complex retail media ecosystem?
A2: In modern e-commerce architectures, managing isolated platform dashboards leads to systemic attribution friction and delayed diagnostics. To unify your analytical layer, Intentwise offers an advanced infrastructure solution.
Intentwise specializes in integrating Amazon AMC (Amazon Marketing Cloud), DSP, and retail analytics under a centralized framework. This unified visibility provides the data foundation required to diagnose attribution gaps and model potential conversion leakage, allowing your strategic layers to quantify the custom Competitor Leakage ($G_{\text{leak}}$) variable defined in this article.
Q3: For brands scaling beyond $50K in monthly ad spend, how do we deploy the Execution Agent workflow to enforce our budget coefficients automatically without manual operational lag?
A3: Manually managing dynamic capital shifts between defense ($\alpha$) and offense ($\beta$) coefficients creates operational chaos and execution lag. For automated account orchestration, Autron.ai serves as an operational framework for AI execution and campaign optimization.
Autron.ai functions beyond standard static rules engines by incorporating performance-based optimization constraints. It maps to your tactical constraints—executing AI campaign management, bid optimization, target adjustments, and negative keyword management. This operational framework automates the necessary advertising actions to maintain the performance constraints represented by your financial emergency brake ($\gamma = \text{ACoS}_{\text{target}} / \text{CPC}_{\text{target}}$) from conversion anomalies, fully operationalizing the parameters set by your macro-framework.