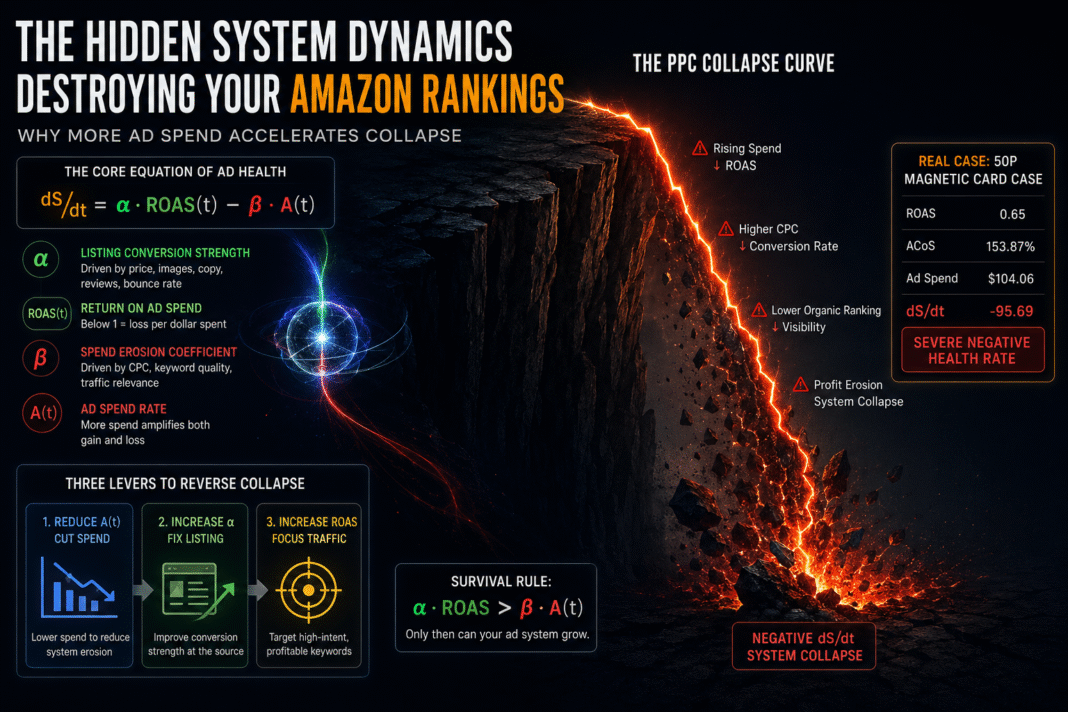

Every Amazon seller loves a spike in sales. When the dashboard turns bright green, it feels like winning. But as seasoned media buyers and portfolio managers, we know that top-line revenue is often a vanity metric. The real question that keeps us up at night isn’t “How much did we make?” but rather: “Are we building a self-sustaining asset, or are we just funding Jeff Bezos’s next rocket ship?”
Many brands trap themselves in an accidental doom loop: scaling ad spend to chase top-line revenue, completely blind to the fact that their paid traffic is aggressively eating away at their organic market share.
To break out of this high-entropy cycle, we must run a holistic diagnostic on our traffic architecture. We need to split the data open and isolate Paid Performance from Organic Pull.
Here is the exact framework for diagnosing your listing’s true baseline health, identifying margin leaks, and structuring a data-driven action plan that forces Amazon’s algorithm to work for you—not against you.
1. The Core Philosophy: “Ad Engine” vs. “Organic Temperature”
Think of Amazon PPC as an external engine and your organic positioning as the brand’s core “body temperature.”
An ad engine is designed to inject velocity into a product. It forces visibility, triggers initial conversions, and feeds data back into the A9/A10 algorithm. However, an engine cannot run at 5,000 RPM forever without melting the margins.
The true metric of a listing’s health is its Organic Temperature. If you kill the ad engine and the product’s visibility instantly drops to zero, the listing has zero structural immunity. It cannot survive on its own.
Fow healthy amazon business , our goal isn’t just to optimize for a lower Advertising Cost of Sales (ACoS). Our goal is to leverage paid trafific to build a compounding organic moat. To see if that is actually happening, we must combine data silos that Amazon intentionally keeps separate.
2. Unifying the Data Silos: The Three Essential Source Reports
To run a clean traffic and order attribution analysis, we have to pull and align three distinct data sources from Seller Central and the Amazon Ads console.
Data Source 1: The Sponsored Products/Brands Activity Report
- Where to find it: Amazon Ads Console > Measurement & Reporting > Reports
- Key Columns:
Impressions,Clicks,Spend,Orders,Sales - Purpose: This defines our known variables. It tells us exactly how much traffic and volume we explicitly bought on any given day at the SKU/ASIN level.
Data Source 2: The Master Order Report
- Where to find it: Seller Central > Reports > Fulfillment > Sales > All Orders
- Key Columns:
amazon-order-id,purchase-date,asin,quantity - Purpose: By deduplicating and counting unique
amazon-order-ids grouped by date and ASIN, we establish the absolute ceiling of our daily volume—combining both paid and natural transactions.
Data Source 3: The Business Report (Detail Page Sales and Traffic by Child asin)
- Where to find it: Seller Central > Reports > Business Reports
- Key Columns:
Sessions,Page Views,Buy Box Percentage - Purpose: This gives us our gross traffic footprint.
Sessionsrepresent the total number of unique customers who visited your listing within a 24-hour window, encompassing every single traffic source (Organic Search, PPC, External Traffic, Badges).
3. The Math: Formulating the Diagnostics
Once these data sets are cleansed and blended using a standardized join key (Date_Country_ASIN), we calculate our two north-star diagnostic metrics.
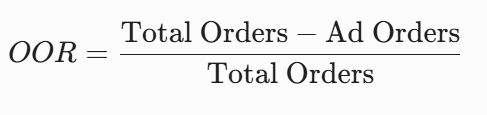
Metric A: Organic Order Ratio (OOR)
This tells us what percentage of our volume is driven by pure product merit and organic keyword rank, completely free of ad-cost drag.
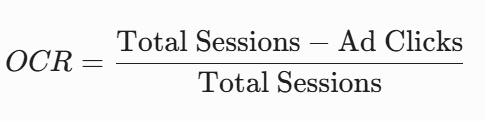
Metric B: Organic Click Ratio (OCR)
This measures our unpaid traffic share, showing whether our organic keyword shelf space is actually expanding.
A Note on Technical Precision for Elite Media Buyers
If you hand this logic to a junior data analyst, they might raise a red flag and say: “Wait, standard Ad Clicks and Business Report Sessions are not mathematically identical units. A click is a raw event; a Session is a 24-hour deduplicated visitor metric. You can’t subtract clicks from sessions cleanly!”
They are technically correct. But as high-level strategists, we do not look at these numbers as absolute point values—we look at them as directional vectors. We don’t care if the OCR calculation has a minor tracking variance on a Tuesday. We care if the delta between Sessions and Ad Clicks is expanding over a 90-day macro trend. If your ad clicks are rising but your total sessions remain flat, your organic traffic is dying. That is the macro truth, regardless of data attribution noise.
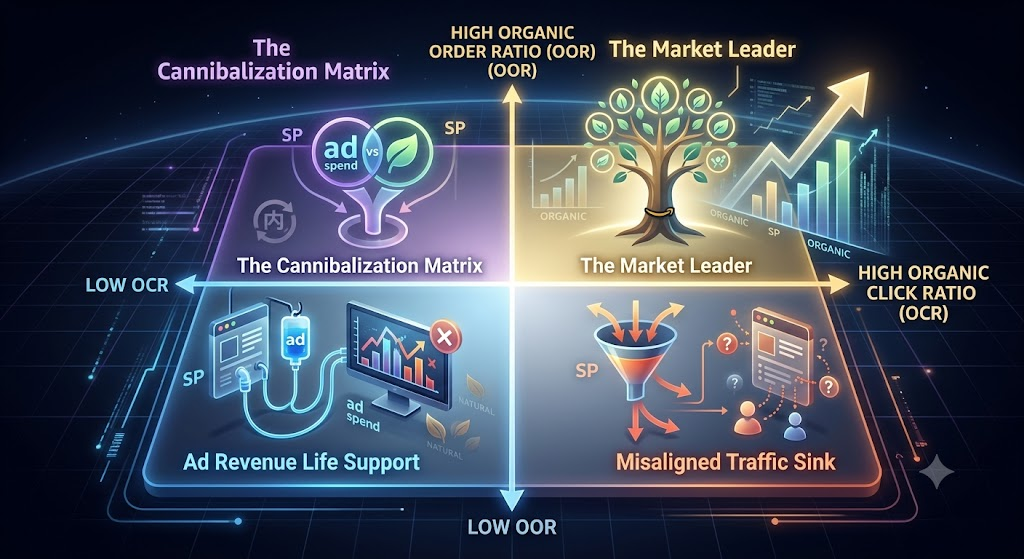
4. The Blueprint: The 4-Quadrant Traffic Health Matrix
Once you map your ASIN portfolio against OOR and OCR, every product will fall into one of four distinct operational quadrants. This is the exact slide you present to stakeholders to justify budget reallocations.
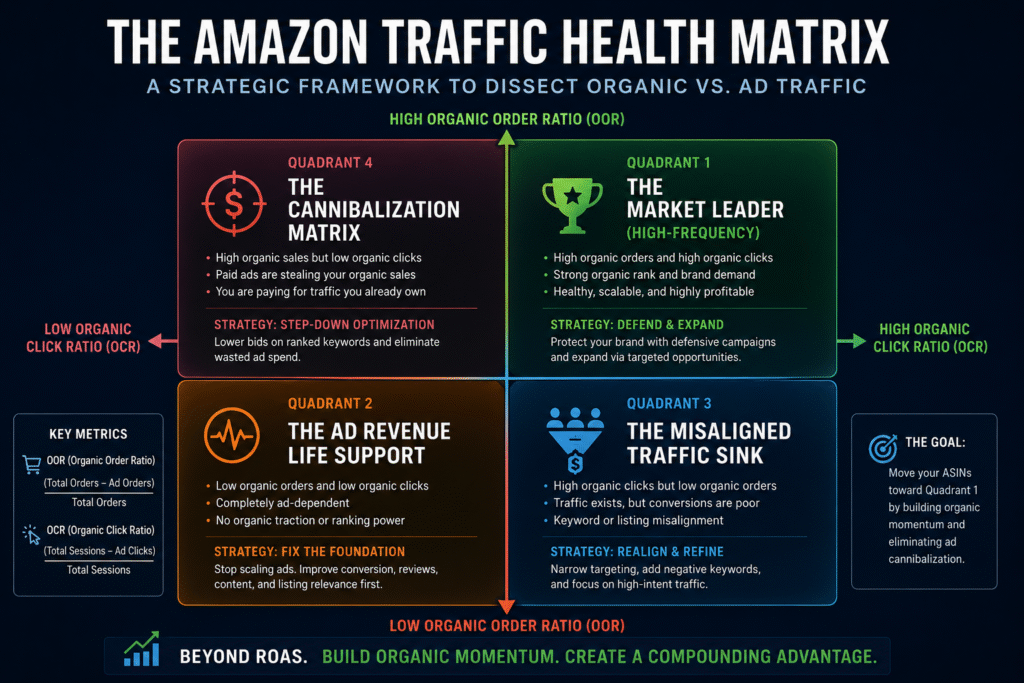
Quadrant 1: The Market Leader (High OOR / High OCR)
- The Diagnostic Summary: Clean, orderly, and highly profitable. The listing possesses massive organic momentum. It owns the top rows of organic search results for high-volume root keywords. Customers are actively seeking out the brand.
- The Strategy: Do not over-saturate. Shift your ad budget away from aggressive, low-margin generic broad match terms. Instead, pivot to Defensive Campaigns (protecting your own product pages from competitors trying to hijack your traffic) and highly targeted Sponsored Display/Video campaigns to capture cross-selling opportunities. Protect the margin.
Quadrant 2: Ad Revenue Life Support (Low OOR / Low OCR)
- The Diagnostic Summary: A high-entropy danger zone. This product is entirely dependent on paid traffic to survive. If you pause the ad campaigns for 48 hours, sales plummet to zero. The listing has zero organic traction, usually caused by poor conversion infrastructure or extreme keyword irrelevance.
- The Strategy: Stop burning cash on scaling spend. More traffic will not fix a leaky bucket. Immediately halt top-of-funnel keyword bidding. Audit the listing’s internal conversion components: consumer social proof (review velocity/rating), visual assets (A+ content, main images), and price elasticity. Re-optimize the indexation layout before re-introducing paid traffic.
Quadrant 3: The Misaligned Traffic Sink (Low OOR / High OCR)
- The Diagnostic Summary: A frustrating paradox. The data shows high organic clicks but very few organic orders, leading to massive paid ad dependencies. This means your SEO or broad ad targeting is bringing people through the door, but they realize the product isn’t what they expected once they arrive.
- The Strategy: This is almost always an indexing or keyword misalignment issue. Your listing is likely ranking for high-volume keywords that are too broad or conceptually tangential to your actual product. You are paying for curiosity, not intent. Narrow your target parameters. Aggressively add negative keywords to your broad/phrase campaigns, and ruthlessly focus your budget on long-tail, high-intent exact match keywords where your product has a distinct competitive advantage.
Quadrant 4: The Cannibalization Matrix (High OOR / Low OCR)
- The Diagnostic Summary: High structural organic sales, but very low calculated organic clicks. This reveals a major operational inefficiency: your paid ads are eating your organic sales. You are paying Amazon for keyword real estate that you already own organically in slot #1 or #2. Buyers who would have clicked your organic link anyway are clicking your Sponsored Product ad right above it, charging you a premium for a conversion you already earned.
- The Strategy: Step-down optimization. Gradually lower bids on exact-match keywords where you already hold a dominant, stable organic rank. Monitor your total order volume closely during this wind-down. If total orders remain steady while ad spend drops, you have successfully eliminated cannibalization, directly returning that wasted ad spend straight back to your bottom-line net margin.